Assessing Changes in the Ideological Identity of Young Women and Men using the CCES
A recent analysis by the Financial Times’ John Burn-Murdoch shows how the political ideology of young women and young men have increasingly diverged in recent years in South Korea, the U.S., Germany, and the UK. In his accompanying FT column, Burn-Murdoch breaks down these trends and provides additional evidence for the gender-based ideology gap across different countries. A growing difference in the political ideology of young women and men obviously has profound implications for politics, but also social trends more generally. For example, Burn-Murdoch points to the decline in marriage and birth rates in South Korea as reflecting this stark ideological divide.
In the days following Burn-Murdoch’s original post and publication, there was additional discussion on social media about whether this phenomena held across different survey sources in the U.S., with Burn-Murdoch rebutting criticism of his original analysis. One aspect of this discussion included questions over the sample size of the surveys in question, and the resulting precision of the estimates in question.
To add to this discussion, I investigated whether the documented divide between the ideology of young women and men holds true when using the Cooperative Election Study (CES). This survey, which is a high-quality nationally representative election study by a consortium of U.S. universities, has been useful for investigating political trends among young adults in past work by BIFYA. Furthermore, the CES surveys a large number of individuals, with over 50 thousand survey participants in its even year election survey. This large sample size should buttress the accuracy of any estimates made on subsamples, like young adults.
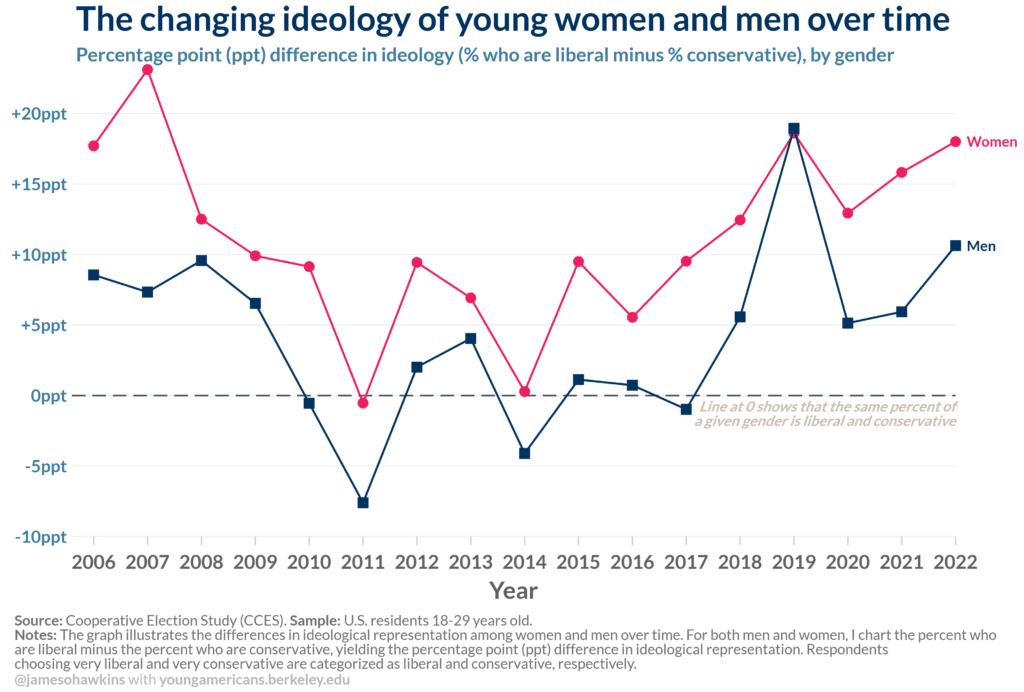
In Figure 1 below, I use the CES to replicate the same analysis as in Burn-Murdoch’s original viral chart, which shows the percentage point difference in ideology for each gender among young adults 18-29 years old. Specifically, I calculate the percent of the young adult population who is liberal and conservative, and take the difference between percent of the population who is liberal and the percent of the population who is conservative for each gender. This means that, for each gender, a higher number on this chart shows that a greater share of that gender’s young adult population is liberal than conservative. Values at (or close to) the zero percentage point line show liberal and conservative representation is equal (or near-equal). I compile ideology statistics across all years of the CES, from 2006-2022 – unlike Burn-Murdoch’s analysis, the CES does not include samples from the 1990’s or 2000’s.
Figure 1 shows that, on average in the available CES survey years, a higher share of young women are liberal compared to young men. Interestingly, these results also show that, for both genders, the liberal share of young adults declined relative to the conservative share in the early 2010’s and has generally been on an upward trend since about 2017. Today, the share of young liberal men is about ten percentage points higher than the share of young conservative men. Representation of liberal women is even greater.

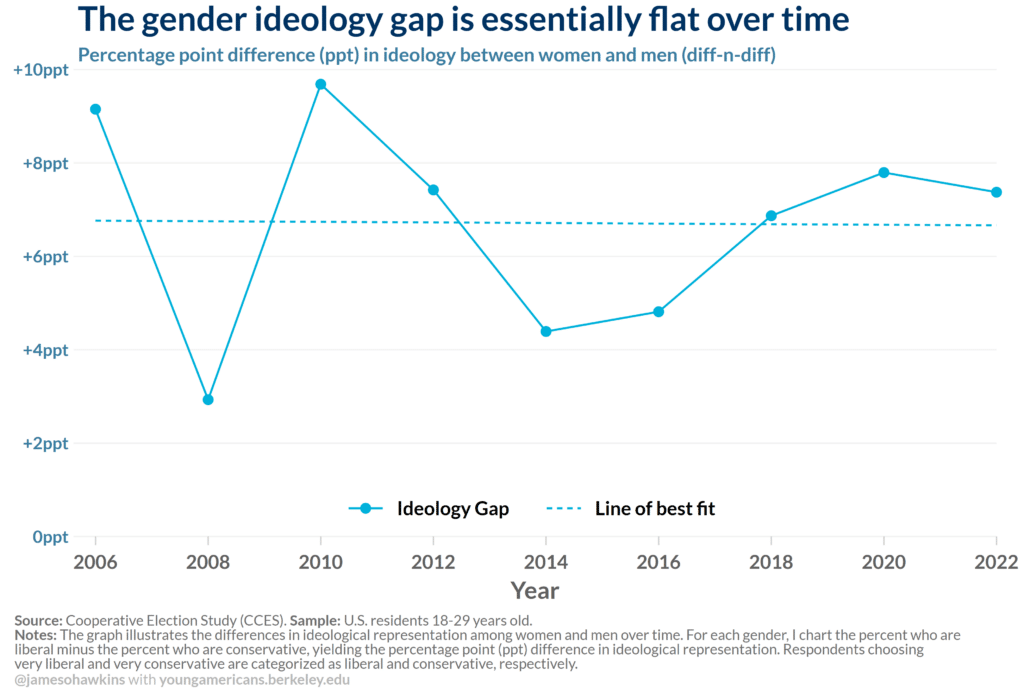
Importantly, Figure 1 does not seem to support the case for a diverging ideological divide between young men and young women in the U.S. Both women and men have lower liberal representation relative to conservative representation in the CES than in Burn-Murdoch’s original analysis using the Gallup Poll Social Series. And while my analysis covers a different timeframe – it starts in a later year than Burn-Murdoch’s analysis – there is seemingly no growing gap in the last five to ten years available in the survey. But I personally find it difficult to precisely judge the gender gap from by examining this chart alone. Furthermore, the estimates from the odd years of the CES are noisy, and may be distracting from the underlying trend that is better detected in the larger even year samples. To address this, in Figure 2 I directly measure the size of the ideology gap to better assess whether the diverging ideological representation among young men and women is apparent in the even years of the CES. The measure in Figure 2 can be thought of as a crude “difference-in-differences” (a double difference) since it measures the 1) difference between percent who are liberal and percent who are conservative (percent liberal minus percent conservative) and 2) the difference among women and men (#1’s measure for women minus #1’s measure for men). In simpler terms, Figure 2 directly measures the magnitude of the ideology gender gap shown in Burn-Murdoch’s original work.
The naive measure in Figure 2 makes apparent that there is seemingly no trend in the gap over time using the even years of the CES. A simple line of best fit, shown with a dashed line, shows that the average size of the ideology gap between women and men is essentially flat over time. At its height in 2010, the gap stood at close to 10 percentage points, but has since fallen, and stood at about 7 percentage points as of 2022.

Apart from Burn-Murdoch’s viral chart, there have been a number of analyses highlighting the gender ideology divide across the globe. Other surveys in the U.S. also show that the ideology of men and women are drifting further apart. And, if the gap is indeed growing, it has profound implications for U.S. society and the world. But, at least when it comes to the CES, we see no evidence of such a drift through 2022.


