Economic Opportunity Index

Summary

How have young people fared since the Great Recession?

Below is an Economic Opportunity Index that is part of a Working Paper focused on economic mobility for young people. The Index measures changes in key indicators including college education, health insurance, employment, affordable housing, and income from 2007 until 2016. The results for young people are not looking good: While young people have seen gains in education and health care coverage since the onset of the recession, young people have fared worse than older generations when it comes to affordable housing and income.
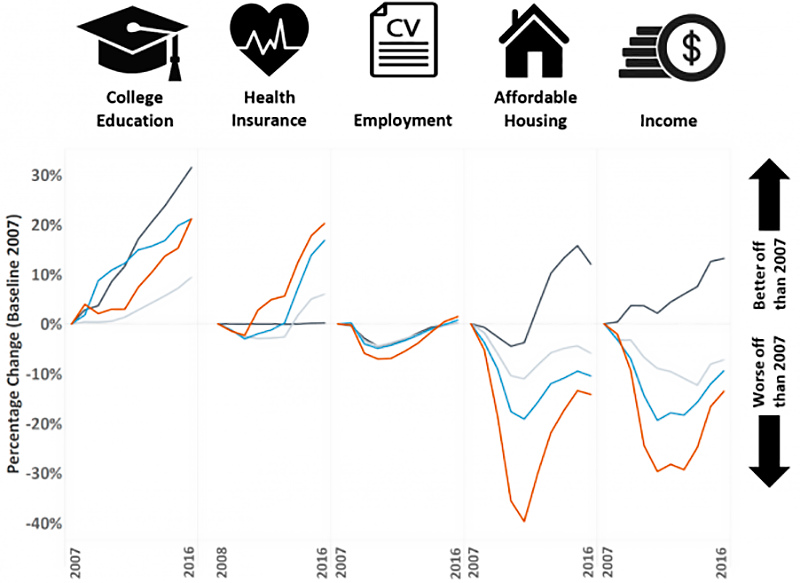
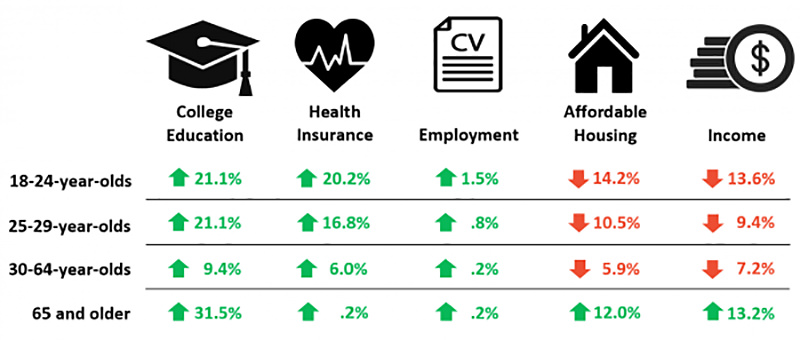
Sources: Author’s analysis of IPUMS-ACS, University of Minnesota, www.ipums.org; and “Out of Reach,” National Low Income Housing Coalition, www.nlihc.org/oor.

Notes: The education indicator measures the change in the proportion of each age group with a college degree or higher; the health indicator measures the change in the proportion of each age group covered by health insurance (due to data limitations, the health insurance indicator displays the change since 2008); the employment indicator measures the change in the proportion of each age group employed in a job relative to the entire labor force (this differs from the labor force participation rate, which measures the group of individuals working and looking for work relative to the entire population); the housing indicator measures the change in the proportion of each age group that can afford a zero-bedroom fair market rent apartment in their state based on 30 percent of their income; and the income indicator measures the change in cash income within each age group.

Related Posts

KQED Political Breakdown, April 2024 As part of KQED’s Youth Takeover, we hear from young voters about the issues they care about most ahead of a presidential election. From the war...
California Sun Podcast, February 2024 The Berkeley Institute for Young Americans, part of the Goldman School of Public Policy at UC Berkeley, examines the evolving generational dynamics of millennials and...
Student debt levels have been rapidly increasing over the last several decades and in 2021, the national student loan debt surpassed $1.7 trillion. In light of this trend and with...
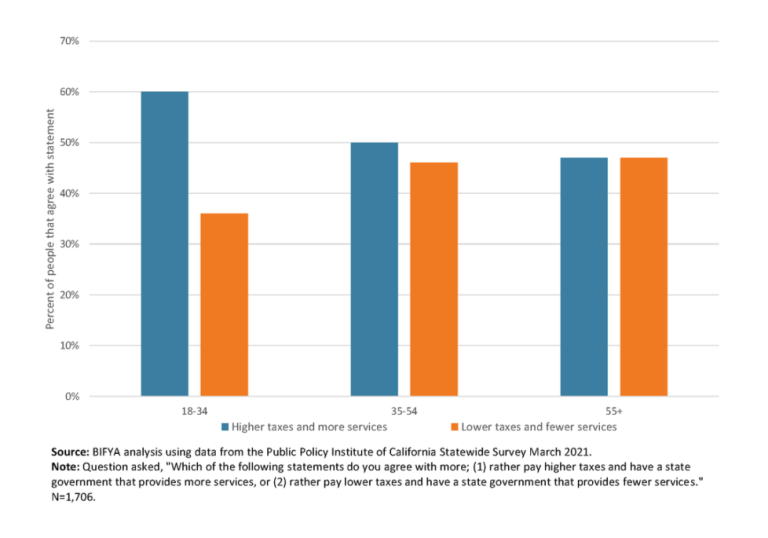
We analyzed data from the latest statewide survey from the Public Policy Institute for California (PPIC). In a question that asked whether you’d “rather pay higher taxes and have a...
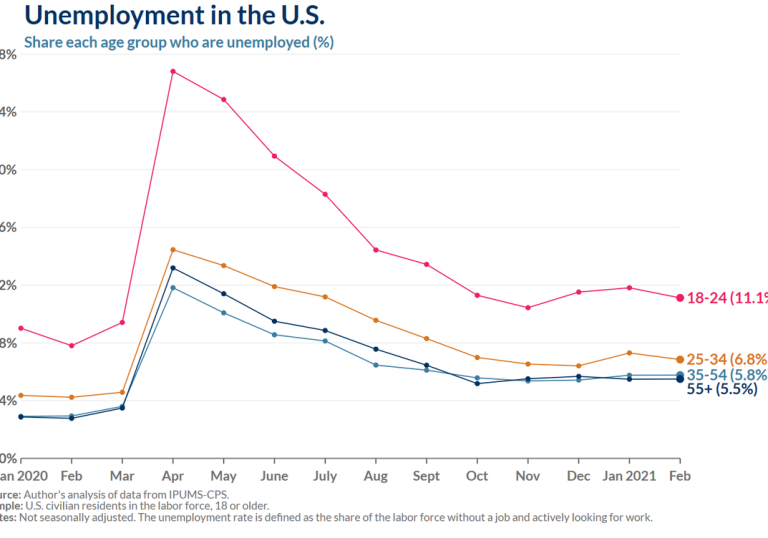
This month marks the one-year anniversary of the COVID-19 pandemic. We took a look at unemployment and long-term unemployment by age to see how the economic changes brought on by...
As policymakers consider the best path forward, we are publishing an interactive calculator to model potential policy designs for national relief payments in real-time. We hope that this will help...
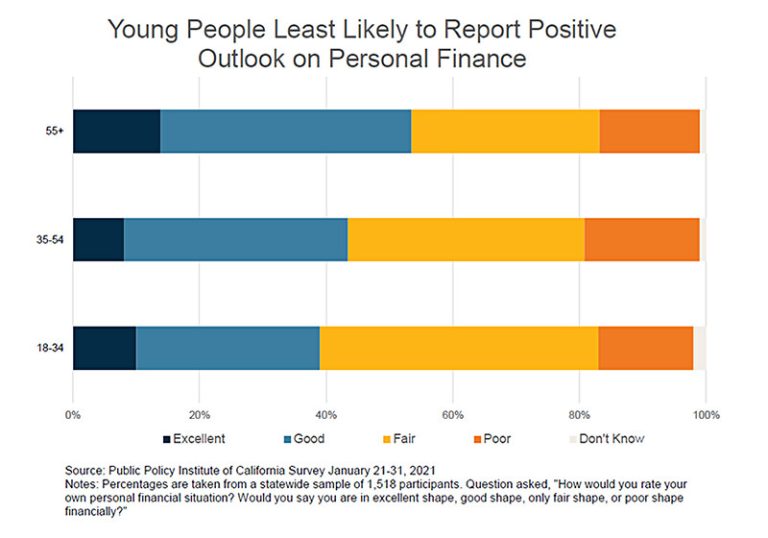
We used the latest statewide polling data (January 21-31, 2021) from the Public Policy Institute of California (PPIC) to understand whether there were differences in self-reported financial outlooks between age...
With the onset of the COVID-19 pandemic, young adults once again are facing the highest unemployment rates of any age group with mounting financial pressures in an uncertain economy. In...

  |  

The figure below tracks when pandemic extensions to the social safety net were initially set to expire.  *Some of these dates have since changed as some programs were subsequently extended.
We are collaborating with the City of Los Angeles’ i-team and the Economic and Workforce Development Department (EWDD) to support unemployed Angelenos who are seeking training or employment opportunities. We...