Historic Trends in U.S. Student Debt

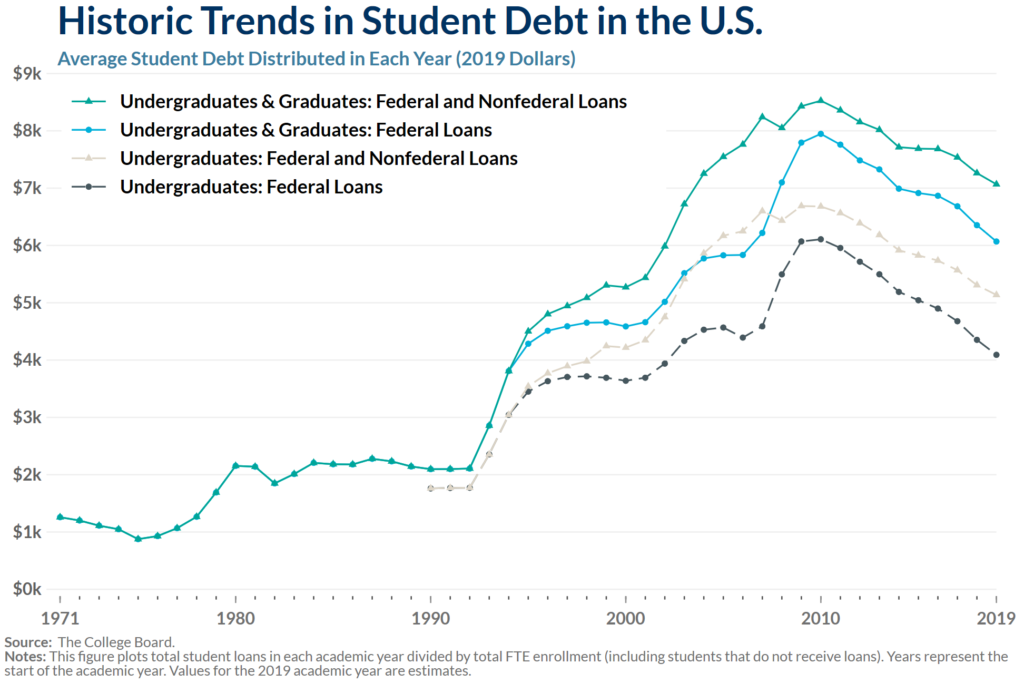
Student debt has been on the rise since the 1970s. Below, we break down trends in student debt over time by plotting all total student loans in a given year divided by total full-time student enrollment. In other words, we plot how much debt each full-time student enrolled in higher education would have if the debt were distributed evenly. As shown, average student debt significantly increased between 1991 and 2010, reaching a high of roughly $8,500 in 2010 before beginning a gradual decline. Federal loans for both graduate and undergraduate students are the most prevalent (the black and blue lines), although the uptake in private, nonfederal loans have increased dramatically since 1992–according to the figure, each student in the U.S. carried about $1,000 in private loans during 2019.

Related Posts

Funding state-wide education isn’t cheap. But a well-funded early care and P-16 system has both direct benefits to students as well as indirect benefits to society. As we review impacts...
How does California fund its schools? Education finance in California has changed over time with a complex set of propositions, lawsuits, and laws that shape how California funds its K-12...
California has ambitious aims for higher education. Lawmakers established goals in the state’s education code to expand college access to more students, improve college affordability, and ensure that more students...
The sustainability of the state’s public education system is questioned in a new report from the Berkeley Institute for Young Americans. Part of the California 100 initiative, administered by the Goldman School of...