How does California fund its schools?
Education finance in California has changed over time with a complex set of propositions, lawsuits, and laws that shape how California funds its K-12 and higher education system.
What’s inside
As part of the California 100 project, we’ve created a comprehensive online resource that is a first-of-its-kind to compile information about these propositions, laws, and litigation in one place. We also created an annotated bibliography of literature offering new ideas to continue reforming the school finance system, offer supporting graphics of how the state currently funds its K-12 and higher education systems, and provide an overview of why it’s so important to fund education for California’s future. . We invite you to explore these resources by downloading the complete Quick Guide to CA School Finance Laws, Propositions, and Ideas for Reform below.
- Statewide propositions (Table 1) passed from 1978 through 2020 that address state financing. Examples include Prop 13 – which limited the state’s ability to collect property taxes – to Prop 51 which provided $9 billion in bonds to fund school facility improvement for K-12 and community colleges.
- Litigation (Table 2) about school financing from 1955 to 2004. Includes Williams vs. California, which determined that the state should provide resources necessary for schools to educate its students at a high standard.
- Laws (Table 3) that govern how property tax is distributed to schools and community colleges and in some cases, shared with local governments. Also includes information about the state’s landmark Local Control Funding Formula (LCFF).
- Ideas (Table 4) to reform the education system. We provide an annotated bibliography documenting existing ideas to transform the state’s school finance system to be more equitable and sustainable in the long-run.
- Summary of education benefits (Text Box 1) that details how investing in state education pays itself back for individuals and society from early care through college.
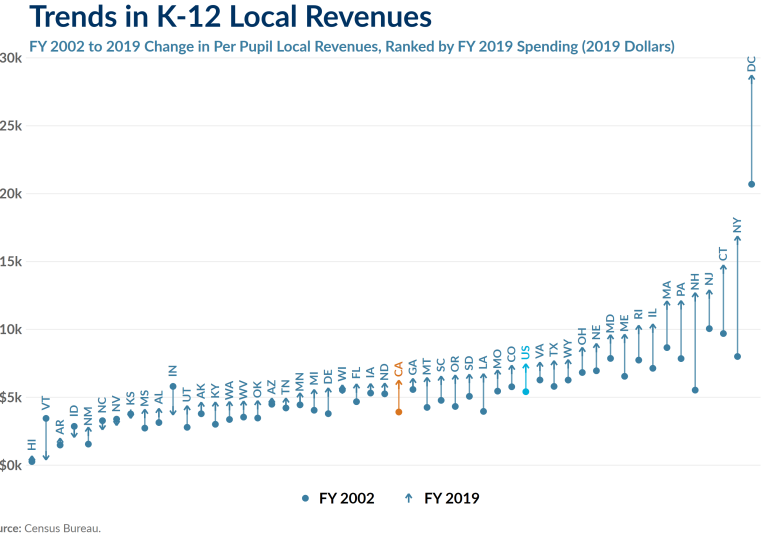
- Charts and graphs (Figures A1-11) that showcase:
- Trends in K-12 federal, local, and property tax revenues
- Trends in higher education expenditures and revenues
- Trends in general fund expenditures
- Composition of higher education revenues


