Executive Summary
The purpose of this paper is to gain a descriptive understanding of unified districts that became at-risk of financial insolvency during the Great Recession and its immediate aftermath, the last large-scale, multi-year fiscal crisis that destabilized school funding in California. This project describes the demographic and enrollment trends, budgets, and operational decision-making of a cohort of 86 unified school districts that transitioned from good financial standing to at-risk of insolvency between 2008-09 and 2012-13. Using publicly available data from the California Department of Education (CDE), we compare this at-risk cohort to districts that remained in good financial standing during the same period and analyze how district student composition, revenues, expenditures, balance sheets, and operational decision-making compare for both sets of districts over three time periods (the pre-period from 2004-05 to 2007-08, the Great Recession period from 2008-09 to 2012-13, and the post-period from 2013-14 to 2020-21). This paper offers insights for policymakers and practitioners about why the last major fiscal crisis may have pushed some unified districts into at-risk status, what happened to their budgets and funding priorities, and how they recovered. The paper also offers insights into the types of districts that may be likely to become at-risk of financial insolvency during any future fiscal crisis.
We find that:
- At-risk districts were more likely to be large, serve disadvantaged students and students of color, and experience sharper declining enrollment. Districts that became at-risk of financial insolvency during the Great Recession served more students, were more likely to experience enrollment declines, and served a higher percentage of students eligible for Free and Reduced Price Meals (FRPM)—a proxy for low-income status—more English Language Learner (ELL) students, and more students of color than districts that remained in good financial standing. Some districts that became at-risk during the recession remained in at-risk status for several years following the recession and state budget crisis, and some of the districts in our sample have continued to experience at-risk status in more recent years.
- There was little-to-no difference across periods for total expenditures and resources by risk status. Over each period, the at-risk cohort and comparison group received nearly the same amount of resources as the comparison group, and also spent nearly the same (excluding LAUSD as an outlier). Any variation in total resources or expenditures between the two groups was largely due to capital funds rather than operating funds.
- Districts that were at-risk during the Great Recession received more revenue from state and federal sources and less from local revenue or other resources. Over time, the at-risk cohort received more per pupil funding from state and federal sources than the comparison group, especially from resources that target low-income students. The at-risk cohort received less revenue from local sources such as property taxes, parcel taxes, or from local fundraising. The at-risk cohort also had less per pupil revenue from other resources, such as the sale of bonds.
- Districts at-risk of insolvency had slightly higher operating expenditures, lower capital expenditures. Over time, at-risk districts had slightly higher expenditures on employee benefits and classified support salaries, along with higher costs associated with special education—cost pressures that increased during the recession period. The at-risk district cohort spent less on capital outlay, such as the improvement of buildings, and spent less per ADA on bonds sold at a discount than the comparison group during the Great Recession.
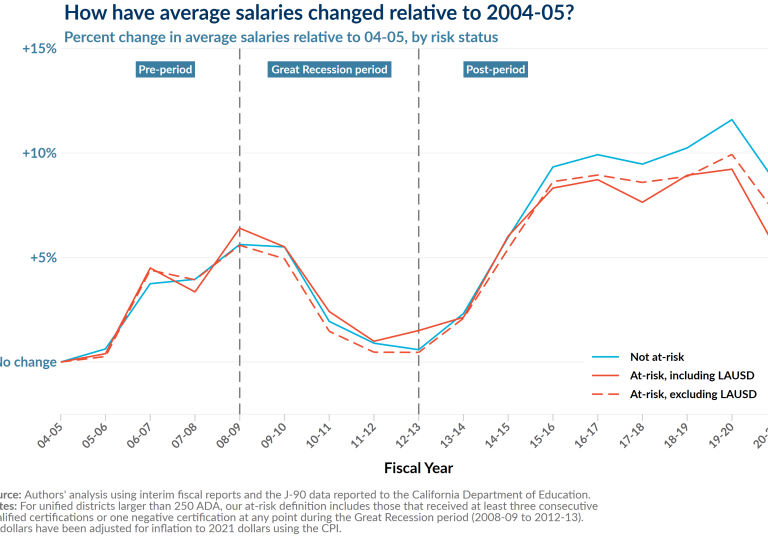
- Both at-risk districts and the comparison group made operational decisions during the Great Recession that affected school quality. Both at-risk districts and those in good financial standing cut instructional days during the Great Recession, but at-risk districts cut about a day more and took longer to recover instructional time than districts that remained in good financial standing. The analysis also showed that the at-risk cohort including LAUSD lost far more FTEs than the comparison group; however, if LAUSD is excluded from the at-risk sample, the not-at-risk districts shed proportionately more FTE positions in comparison to the at-risk cohort. The at-risk cohort also made spending cuts to teacher salaries that were on par with the comparison group.
- The at-risk district cohort had a weakened balance sheet. The at-risk cohort (without LAUSD) entered the recession with less cash on hand than districts that remained in good financial standing, and this worsened during the recession period when the difference in available cash was reduced by more than double. Districts at-risk of insolvency also had fewer reserves in the recession period, were more likely to transfer resources between internal funds, and were more likely to engage in external borrowing practices. Notably, the weaker reserve picture persists for the at-risk cohort into the post-period, indicating that the recession had a prolonged effect on the budgets of districts that experienced insolvency status during the Great Recession.


